The Problem with Python Package Structure in dev Mode

If you are trying to develop a python package and facing difficulties in doing so, this article may help.

The Issue

Recently, I was trying to develop a python package for a data science project. I generated my project using Data Science Cookiecutter. The folders were organized in the following way –

    ├── LICENSE
    ├── Makefile           <- Makefile with commands like `make data` or `make train`
    ├── README.md          <- The top-level README for developers using this project.
    ├── data
    │   ├── external       <- Data from third party sources.
    │   ├── interim        <- Intermediate data that has been transformed.
    │   ├── processed      <- The final, canonical data sets for modeling.
    │   └── raw            <- The original, immutable data dump.
    │
    ├── docs               <- A default Sphinx project; see sphinx-doc.org for details
    │
    ├── models             <- Trained and serialized models, model predictions, or model summaries
    │
    ├── notebooks          <- Jupyter notebooks. Naming convention is a number (for ordering),
    │                         the creator's initials, and a short `-` delimited description, e.g.
    │                         `1.0-jqp-initial-data-exploration`.
    │
    ├── references         <- Data dictionaries, manuals, and all other explanatory materials.
    │
    ├── reports            <- Generated analysis as HTML, PDF, LaTeX, etc.
    │   └── figures        <- Generated graphics and figures to be used in reporting
    │
    ├── requirements.txt   <- The requirements file for reproducing the analysis environment, e.g.
    │                         generated with `pip freeze > requirements.txt`
    │
    ├── setup.py           <- makes project pip installable (pip install -e .) so src can be imported
    ├── src                <- Source code for use in this project.
    │   ├── __init__.py    <- Makes src a Python module
    │   │
    │   ├── data           <- Scripts to download or generate data
    │   │   └── make_dataset.py
    │   │
    │   ├── features       <- Scripts to turn raw data into features for modeling
    │   │   └── build_features.py
    │   │
    │   ├── models         <- Scripts to train models and then use trained models to make
    │   │   │                 predictions
    │   │   ├── predict_model.py
    │   │   └── train_model.py
    │   │
    │   └── visualization  <- Scripts to create exploratory and results oriented visualizations
    │       └── visualize.py
    │
    └── tox.ini            <- tox file with settings for running tox; see tox.testrun.org

In Python, you can install your local package using pip install -e . It allows you to install your package as you develop it and allows importing your own modules (that resides in your package/project) easily. If you are confused about python packages vs modules and how they work, you can read this article.

Despite developing my own package before, I was not able to properly install and import it this time.

>>> import my_pacakge
Traceback (most recent call last):
  File "<stdin>", line 1, in <module>
ImportError: No module named my_package

What I tried-

__init__.py: Checked and made sure it was there.
checking pip list: My local dev package (my_package) was listed there
checking sys.path: sys.path had my project path. Please note, if you install your development package through pip install -e . then sys.path should have the package path.

I was using conda on windows. So I thought it was some permission issue. So I followed this and gave all the permissions for Anaconda. But that does not solve the problem either. I still thought it was some windows/conda permission or path related issue until I installed another local development package of mine. That package works!!

So it has to be some setup.py related issue?

In the working version – all of my source code for the package was in a root folder with the same name of the package. But in the current one, root folder for all the package code is src folder and I tried to declare setup.py in following way –

from setuptools import find_packages, setup
setup(
    name='my_package',
    package_dir={'': 'src'},
    packages=find_packages('src'),    
    version='0.1.0',
)

I tried to print find_packages(‘src’) and it was returning the modules perfectly – ['my_package', 'my_package.data', 'my_package.features', 'my_package.models', 'my_package.visualization'], but was not working when I installed it in developer mode.

The Solution (or Problem?)

With hours of searching, I found the real problem in this very old github issue posted in pip repo (also here). It seems setuptools (and thus pip) does not like renaming the package root folder in developer mode. Finally, the problem was resolved by creating a folder with the same name as the package (inside src; look bellow for reference) and then move everything there. You can put the folder anywhere in your project, but I put it in src folder for my organization. In that way I could put my tests in src/tests and make the project root tidy.

The original issue, however, remain unresolved. I have not found anything that follows up the issue on Pip or setuptools repository.

# setup.py
from setuptools import find_packages, setup

setup(
    name='my_package',
    package_dir={'': 'src'},
    packages=find_packages('src'),    
    version='0.1.0',
    description='A short description of the project.',
    author='K.M. Tahsin Hassan Rahit'
)

    ├── LICENSE
    ├── Makefile
    ├── README.md
    ├── data
    ├── docs
    ├── models
    ├── notebooks
    ├── references
    ├── reports
    ├── requirements.txt
    ├── setup.py           			<- makes project pip installable (pip install -e .) so src can be imported
    ├── src
    │   ├── my_package	   			<- Source code for use in this project.
    │   │	├── __init__.py			<- Makes my_package a Python module
	│	│   ├── data
	│	│   │   └── __init__.py		<- Makes my_package.data a Python module
	│	│   │   └── make_dataset.py
	│	│   │
	│	│   ├── features
	│	│   │   └── __init__.py		<- Makes my_package.features a Python module
	│	│   │   └── build_features.py
	│	│   │
	│	│   ├── models
	│	│   │   └── __init__.py		<- Makes my_package.models a Python module
	│	│   │   ├── predict_model.py
	│	│   │   └── train_model.py
	│	│   │
	│	│   └── visualization
	│	│   │   └── __init__.py		<- Makes my_package.visualization a Python module
	│	│   │   └── visualize.py
    │   ├── tests	   			<- Tests file for my source code
    │
    └── tox.ini
Like
Like Love Haha Wow Sad Angry
Forecasting from Times Series model using Python

Playing with large set of data is always fun if you know how to do it. You can fetch interesting information from it. As part of my Master’s course I have had opportunity to work on forecasting using Times Series modeling. And yes, now I can predict future without being a clairvoyant. 😀

Considering popularity of R in Data Science, I started with R. But soon I realized it has learning curve. So, I opt out for Python. I am not going to write R vs Python because it is already written nicely here in DataCamp’s blog.

So, let’s get started. Time series models are very useful models when data points collected at constant time intervals. This time series stationarity is main per-requisite for the dataset. Until unless your time series is stationary, you cannot build a time series model. There is a popular example named “Random Walk”. The summary of the example is prediction becomes more inaccurate as input data is randomize.

We will use two completely different dataset to for prediction.

  • Nile Water Level between AD 622 to AD 1284. Get it here
  • Air Quality data of Italy taken on Hourly basis. Get it here

The reason we are taking two different model because we want to show multiple different Time Series models.

ARMA:

ARMA is basically combination of two different time series model AR and MA. AR stands for Auto Regressive and MA stands for Moving Average. In ARMA we work with single dependent variable indexed by time. This method is extremely helpful when we do not have any other data than time and one specific type of data. For example in case of Nile data we only have the water level data which is indexed by time(year). I am giving you warning, if your data is not stationary you will be tearing off all of your hair to fit the model. So, make sure your data is consistent to save your hair.

We have used Pandas for Data management.

We have used StatsModels ARMA method for prediction. It takes an mandatory parameter order which defines two parameters p,q of ARMA model. p is the order for AR model and MA is for MA model. Full API reference for this function can be found here. StatsModels also provides ARIMA modeling. In case of ARIMA model we just have to pass difference order parameter.

The predictors depend on the parameters (p,d,q) of the model. Here is the short description about it.

  1. Number of AR (Auto-Regressive) terms (p): AR terms are just lags of a dependent variable. For example if p is 5, the predictors for x(t) will be x(t-1)….x(t-5).
  2. Number of MA (Moving Average) terms (q): MA terms are lagged forecast errors in prediction equation. For example if q is 5, the predictors for x(t) will be e(t-1)….e(t-5) where e(i) is the difference between the moving average at the ith instant and actual value.
  3. Number of Differences (d): These are the number of nonseasonal differences, i.e. in this case we took the first order difference. So either we can pass that variable and put d=0 or pass the original variable and put d=1. Both will generate same results.

To calculate p and q I have run Autocorrelation Function (ACF) and Partial Autocorrelation Function (PACF). StatsModels have acf and pacf function to do this for us.

How I have done it:

At first, I have installed Anaconda to get everything I need. Yes. we have gathered the whole zoo to do our data science. Python, Pandas and now Anaconda. Don’t forget you can write your code in IDE named Spider. Whatever…


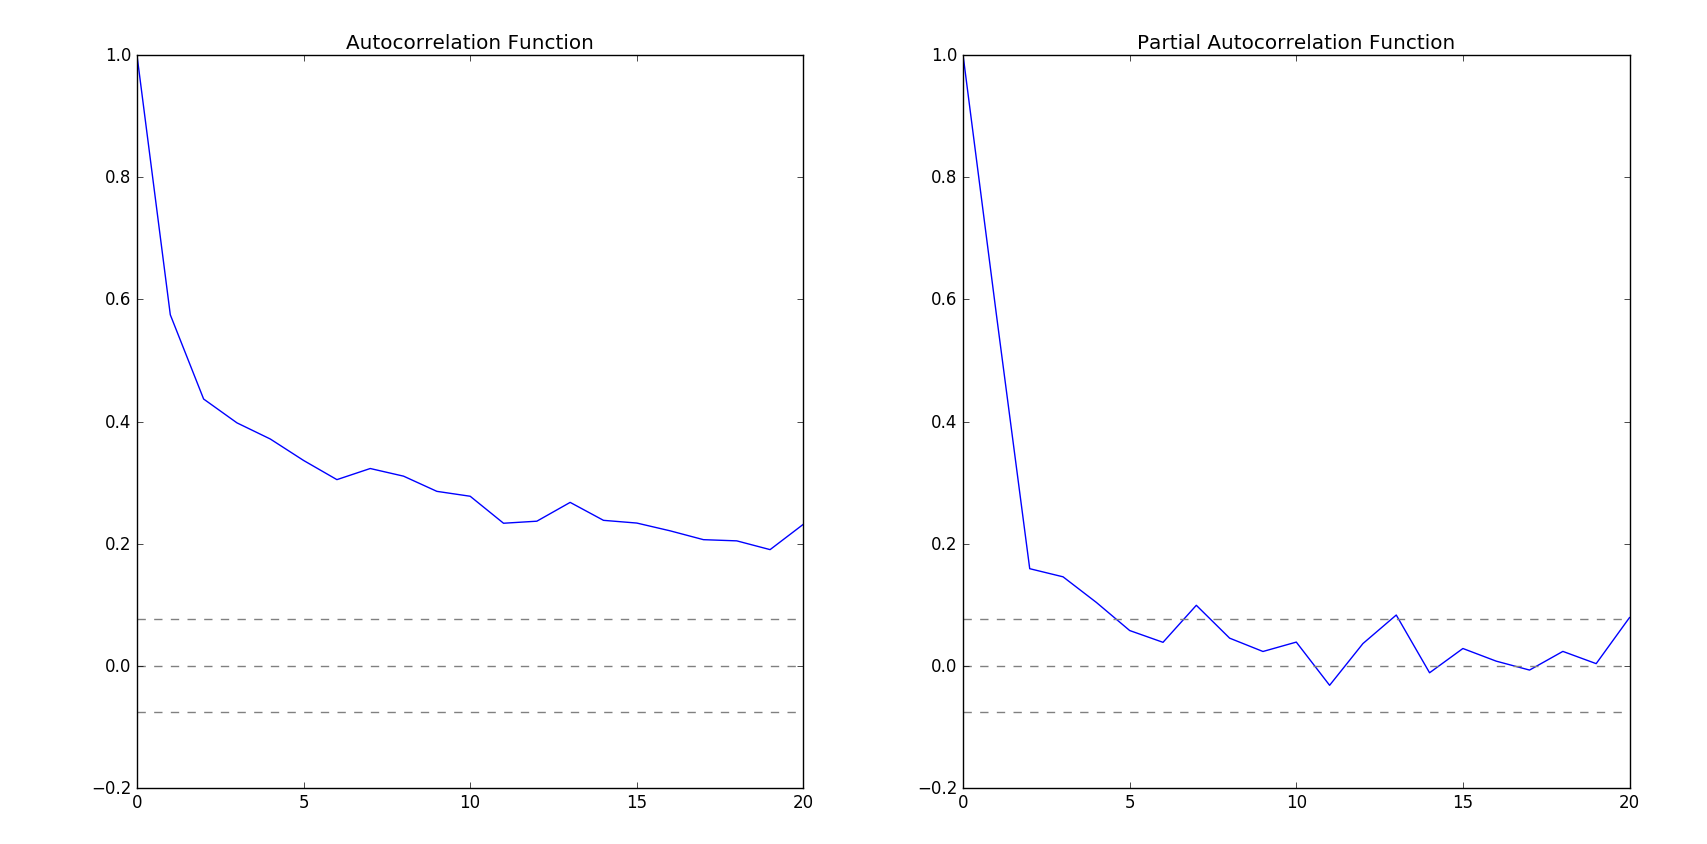
After that, I have used Pandas to read CSV. At first I was trying to fit ARMA on Air data. But since it was hourly data, fitting those data was difficult. Then I moved to Nile data. I was having hard time fitting Nile data because the time span for the data was out of the range of supported timestamp. So, instead of using DateTime index I switched to period range of Pandas. I have generated custom period range to support the time range. The while fitting ARMA model I passed the dates generated by the period range with annual frequency. For p and q order I have used ACF and PACF. I have calculated the lags and then plot it on a graph with bounds.

ACA and PACA observation

ACA and PACA observation

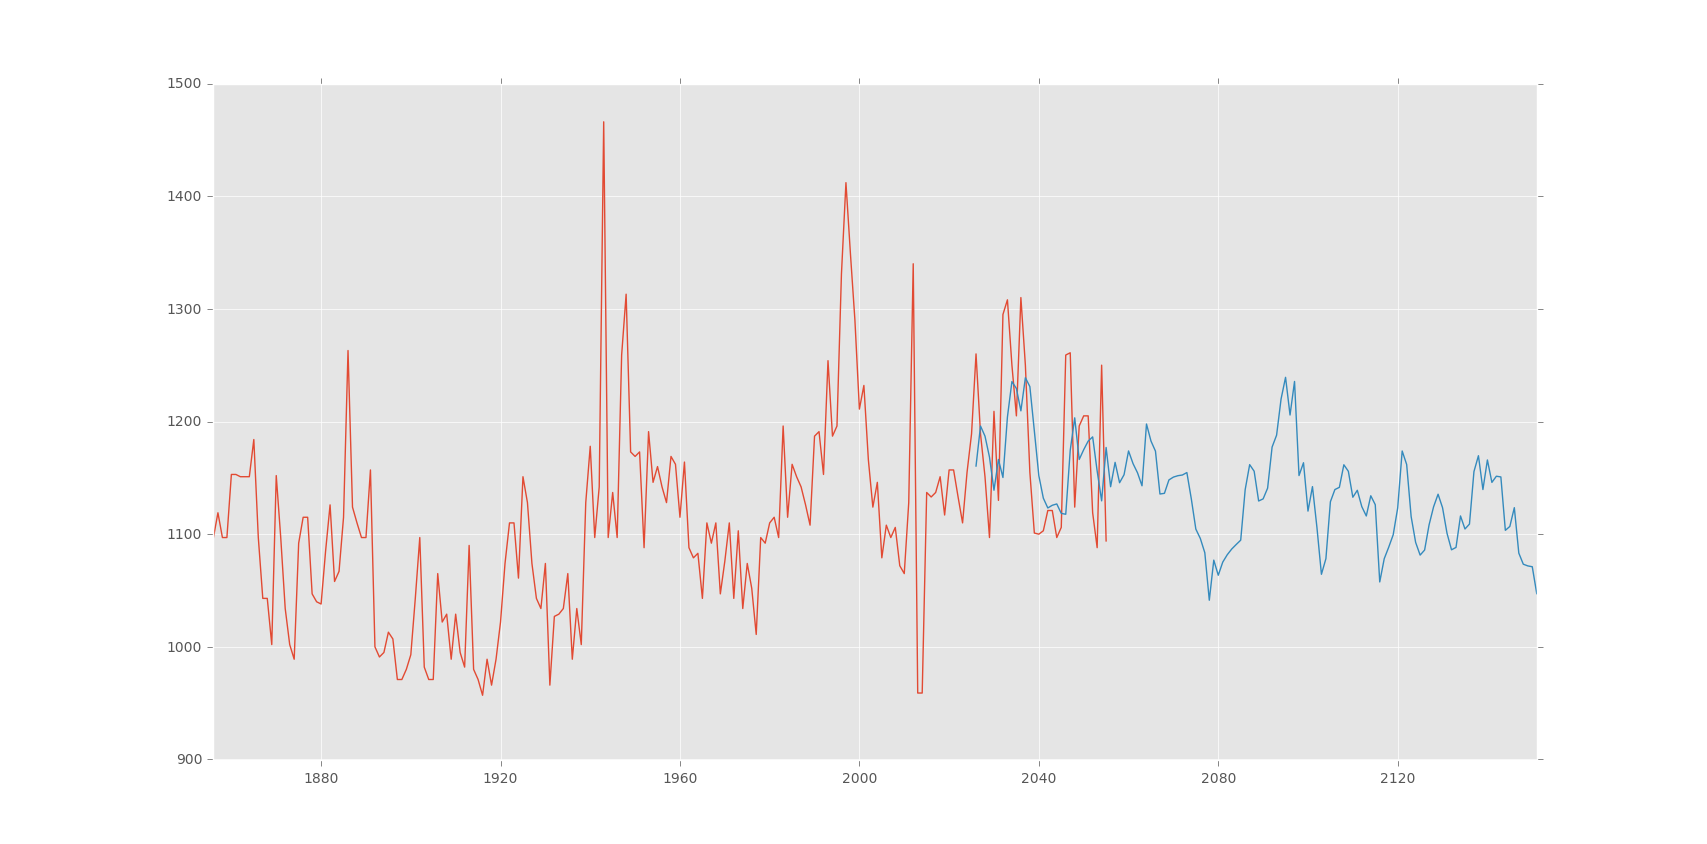
Observing the graph I have taken (2,2) as (p,q) order. After fitting the model I have predicted using the model. Here is the output of the prediction:

Nile Water level prediction

Nile Water level prediction


Linear Regression & Random Forrest Regression:

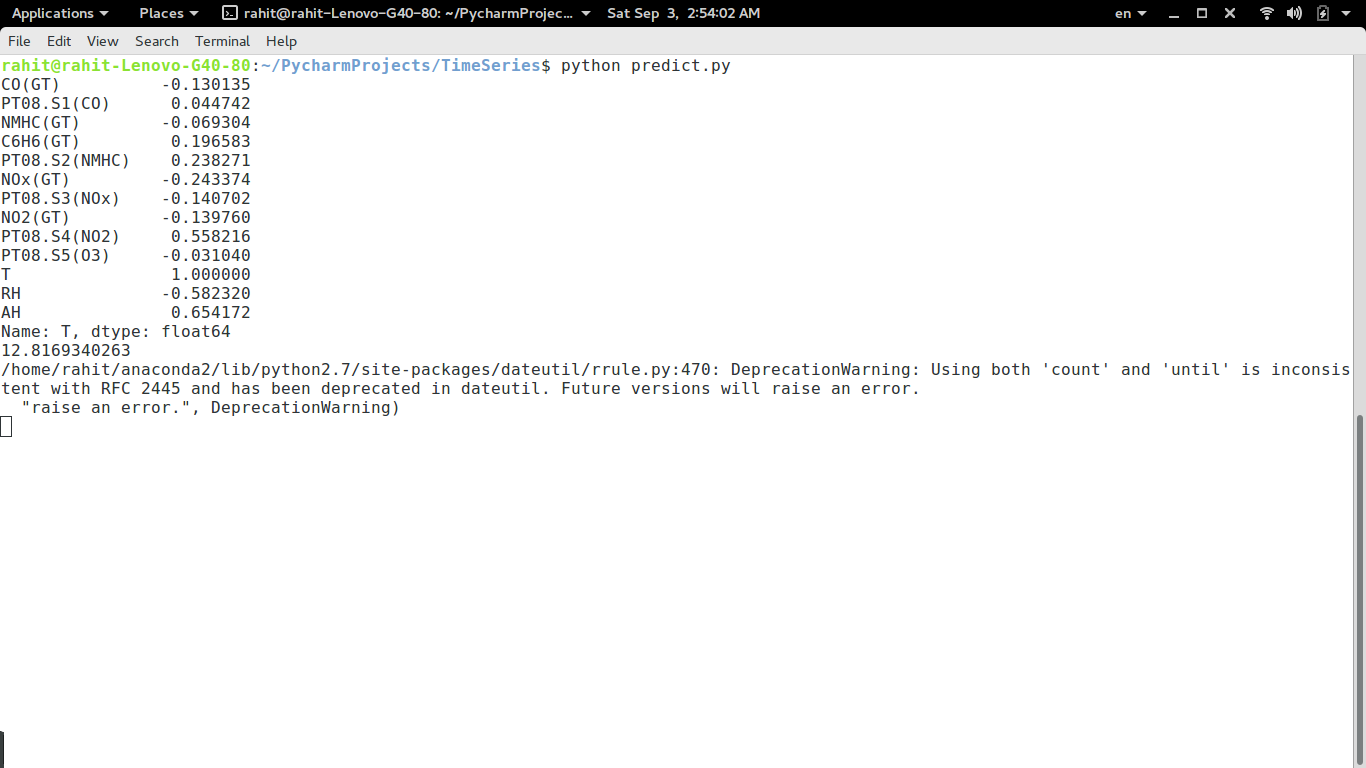
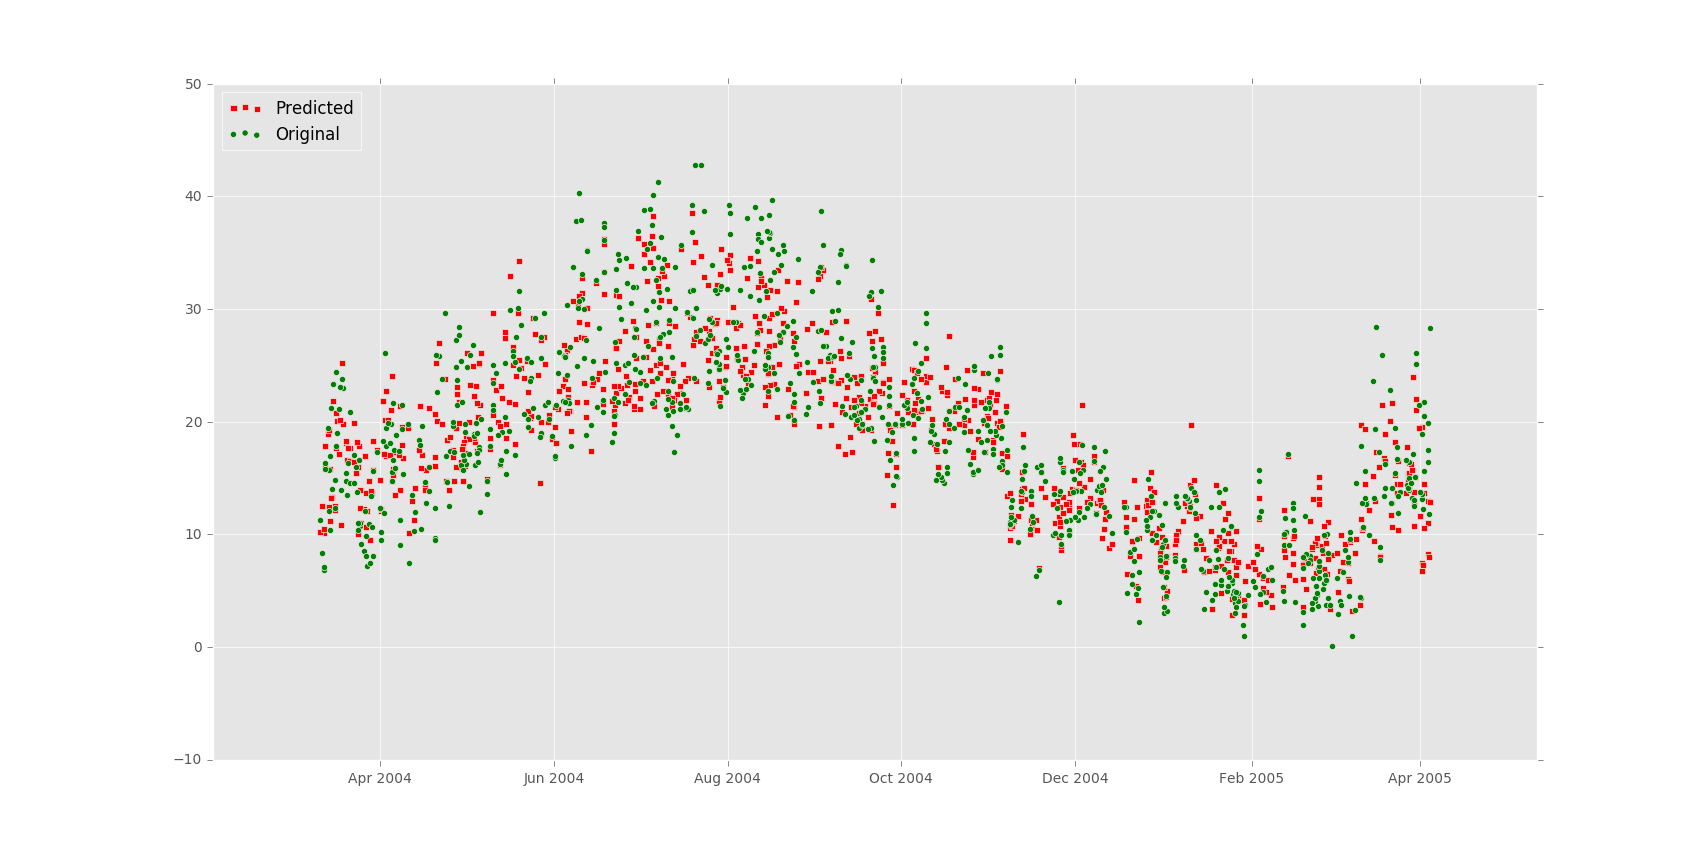
Besides ARMA and ARIMA model we have tried to use other prediction model. One of them are Linear Regression. SciKitLearn provides handful methods to do Linear Regression and Random Forrest Regression. I have ran these models on Air Quality data and got very good output. It has been observed that Random Forrest Regression generates more accurate predictions than Linear Regression. Random Forrest Regression has error rate of 12.8169340263% where as Linear Regression generates output with error rate 29.8718180357%.


How I have done it:

After reading data from CSV using pandas I have dropped NA(not available) or null values. Then I have omitted extreme values. I have run a co-relation calculation with all the columns against Temperature. The output was following:

Corelation with Temperature

Correlation with Temperature

Then I have run prediction model on on the data. I have considered Temperature “T” as the dependent variable and others as the independent variable. The output was following:

Random forrest

Random forest


Here is the code for everything I described above.

Like

Like
Love
Haha
Wow
Sad
Angry

Dynamic form field based on another model’s entries and save them in a m2m way in Django

It’s been a while since I have done this type of brain storming stuff. Today is my country’s victory day and I have got some free time.

Objective:

I have a inventory model named Item. An item can have many attributes such as height, width etc. Think about a system where more attributes can be added in future. I wanted to build such a system where I can dynamically add these attributes so that I don’t need to modify my  model or code for this type of changes.

The idea:

The idea is very simple. I will have 3 models.

  • Item
  • Attribute
  • ItemAttribute

Item model will hold basic information about the item. In Attribute model I can add as many attribute as I wish. This model will have a type field which will determine the type of each attribute such as text, choice, number etc. It is possible to add more fields like length, required etc and add business logic for these. But for keep it simple for now.

ItemAttribute is the many to many relational table between Item and Attribute. It will have an extra field called value to store the value of this attribute.

In short: Item has many Attribute. Each of which has a value. To facilitate this we need many to many (m2m) relation between Item and Attribute.

How it is done:

Here is the gist how I achieved this functionality.

Like

Like
Love
Haha
Wow
Sad
Angry