The Problem with Python Package Structure in dev Mode

If you are trying to develop a python package and facing difficulties in doing so, this article may help.

The Issue

Recently, I was trying to develop a python package for a data science project. I generated my project using Data Science Cookiecutter. The folders were organized in the following way –

    ├── LICENSE
    ├── Makefile           <- Makefile with commands like `make data` or `make train`
    ├── README.md          <- The top-level README for developers using this project.
    ├── data
    │   ├── external       <- Data from third party sources.
    │   ├── interim        <- Intermediate data that has been transformed.
    │   ├── processed      <- The final, canonical data sets for modeling.
    │   └── raw            <- The original, immutable data dump.
    │
    ├── docs               <- A default Sphinx project; see sphinx-doc.org for details
    │
    ├── models             <- Trained and serialized models, model predictions, or model summaries
    │
    ├── notebooks          <- Jupyter notebooks. Naming convention is a number (for ordering),
    │                         the creator's initials, and a short `-` delimited description, e.g.
    │                         `1.0-jqp-initial-data-exploration`.
    │
    ├── references         <- Data dictionaries, manuals, and all other explanatory materials.
    │
    ├── reports            <- Generated analysis as HTML, PDF, LaTeX, etc.
    │   └── figures        <- Generated graphics and figures to be used in reporting
    │
    ├── requirements.txt   <- The requirements file for reproducing the analysis environment, e.g.
    │                         generated with `pip freeze > requirements.txt`
    │
    ├── setup.py           <- makes project pip installable (pip install -e .) so src can be imported
    ├── src                <- Source code for use in this project.
    │   ├── __init__.py    <- Makes src a Python module
    │   │
    │   ├── data           <- Scripts to download or generate data
    │   │   └── make_dataset.py
    │   │
    │   ├── features       <- Scripts to turn raw data into features for modeling
    │   │   └── build_features.py
    │   │
    │   ├── models         <- Scripts to train models and then use trained models to make
    │   │   │                 predictions
    │   │   ├── predict_model.py
    │   │   └── train_model.py
    │   │
    │   └── visualization  <- Scripts to create exploratory and results oriented visualizations
    │       └── visualize.py
    │
    └── tox.ini            <- tox file with settings for running tox; see tox.testrun.org

In Python, you can install your local package using pip install -e . It allows you to install your package as you develop it and allows importing your own modules (that resides in your package/project) easily. If you are confused about python packages vs modules and how they work, you can read this article.

Despite developing my own package before, I was not able to properly install and import it this time.

>>> import my_pacakge
Traceback (most recent call last):
  File "<stdin>", line 1, in <module>
ImportError: No module named my_package

What I tried-

__init__.py: Checked and made sure it was there.
checking pip list: My local dev package (my_package) was listed there
checking sys.path: sys.path had my project path. Please note, if you install your development package through pip install -e . then sys.path should have the package path.

I was using conda on windows. So I thought it was some permission issue. So I followed this and gave all the permissions for Anaconda. But that does not solve the problem either. I still thought it was some windows/conda permission or path related issue until I installed another local development package of mine. That package works!!

So it has to be some setup.py related issue?

In the working version – all of my source code for the package was in a root folder with the same name of the package. But in the current one, root folder for all the package code is src folder and I tried to declare setup.py in following way –

from setuptools import find_packages, setup
setup(
    name='my_package',
    package_dir={'': 'src'},
    packages=find_packages('src'),    
    version='0.1.0',
)

I tried to print find_packages(‘src’) and it was returning the modules perfectly – ['my_package', 'my_package.data', 'my_package.features', 'my_package.models', 'my_package.visualization'], but was not working when I installed it in developer mode.

The Solution (or Problem?)

With hours of searching, I found the real problem in this very old github issue posted in pip repo (also here). It seems setuptools (and thus pip) does not like renaming the package root folder in developer mode. Finally, the problem was resolved by creating a folder with the same name as the package (inside src; look bellow for reference) and then move everything there. You can put the folder anywhere in your project, but I put it in src folder for my organization. In that way I could put my tests in src/tests and make the project root tidy.

The original issue, however, remain unresolved. I have not found anything that follows up the issue on Pip or setuptools repository.

# setup.py
from setuptools import find_packages, setup

setup(
    name='my_package',
    package_dir={'': 'src'},
    packages=find_packages('src'),    
    version='0.1.0',
    description='A short description of the project.',
    author='K.M. Tahsin Hassan Rahit'
)

    ├── LICENSE
    ├── Makefile
    ├── README.md
    ├── data
    ├── docs
    ├── models
    ├── notebooks
    ├── references
    ├── reports
    ├── requirements.txt
    ├── setup.py           			<- makes project pip installable (pip install -e .) so src can be imported
    ├── src
    │   ├── my_package	   			<- Source code for use in this project.
    │   │	├── __init__.py			<- Makes my_package a Python module
	│	│   ├── data
	│	│   │   └── __init__.py		<- Makes my_package.data a Python module
	│	│   │   └── make_dataset.py
	│	│   │
	│	│   ├── features
	│	│   │   └── __init__.py		<- Makes my_package.features a Python module
	│	│   │   └── build_features.py
	│	│   │
	│	│   ├── models
	│	│   │   └── __init__.py		<- Makes my_package.models a Python module
	│	│   │   ├── predict_model.py
	│	│   │   └── train_model.py
	│	│   │
	│	│   └── visualization
	│	│   │   └── __init__.py		<- Makes my_package.visualization a Python module
	│	│   │   └── visualize.py
    │   ├── tests	   			<- Tests file for my source code
    │
    └── tox.ini
Like
Like Love Haha Wow Sad Angry
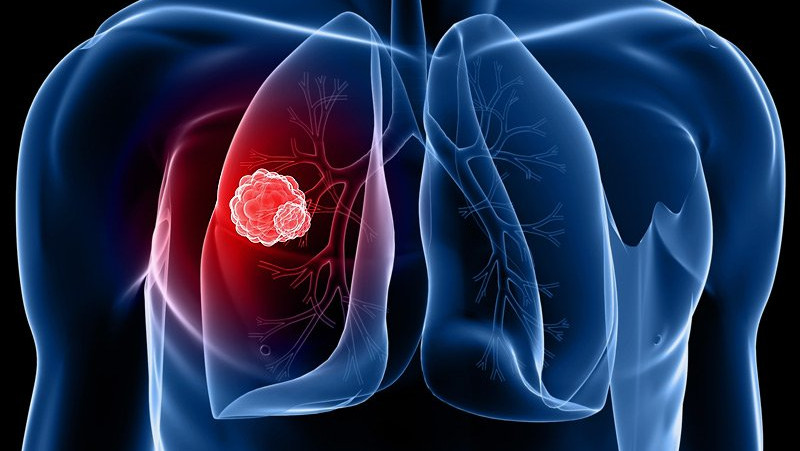
Lung-Cancer-3
Can Machine Learning Really Detect Lung Cancer?

“Artificial Intelligence (AI)” – a topic that is so intriguing throughout last decade that even Elon Musk and Mark Zuckerberg debated over recently. Key integral part of an AI is Machine Learning (ML) which allows a machine to learn how we want them to think. Although it has been almost fifty years since ML and related research work existed, we started exploring its diverse potential to solve many of human problems in this 21st century. One of its blessing we have got so far is in the area of bioinformatics.

Severity of Cancer Diagnosis

Every cancer is unique in its own way. Despite the fact, researchers are continuously trying to identify the causality to make prevention possible. Furthermore, detection of cancer is as important as prevention. Because early diagnosis of cancer shows a higher chance of survival. For instance, a lung cancer patient with localized cancer has 55% survival rate whereas if the tumor spreads to other organ chance drops to 4%. However, only 16% of lung cancer cases are diagnosed at an early stage. Moreover, in 2014, almost 14.5 million people in the US was beyond the reach of cancer diagnosis. Rest of the world especially underdeveloped and developing countries lack more behind in having such facilities.  Reason behinds this includes the necessity of high-quality equipment and expert physicians to diagnose cancer. This is why researchers are trying to incorporate AI and ML algorithms to make the diagnosis process simpler with remarkable accuracy.

Recent Development Through ML

In 2017, Kaggle, most popular data science learning and competition platform hosted Data Science Bowl featuring cancer diagnosis problem. Open sourcing CT scan images to the public, it asked data scientists to come up with a machine learning model that better predicts the probability of lung cancer. In return, Kaggle offered its highest prize money to this date valued one million US dollar. It was three months long competition from February 2017 to April 2017 where almost two thousand teams across the globe participated. After finishing the competition, a new initiative  Concept To Clinic is being taken to develop an open source solution for clinics. This system will enable radiologists to access the solution developed by the researchers through SAAS. Concept To Clinic is funded by The Bonnie J. Addario Lung Cancer Foundation which aim is to make lung cancer a chronically managed disease by next five years. Targeting this challenging vision, development of the system has already begun and has been open sourced on the first week of August 2017 for engineers and data scientists. This initiative also offers monetary rewards based on the contribution one makes. Total prize money valued 100,000 US dollar is announced for top contributors.

Behind The Scene

Detection of lung cancer happens in two major steps: 1) creating ML model and 2) using the model to predict the cancerous region of lungs. To create or train an ML model, researcher feed-in CT scan DICOM image files along with attributes such as tumor size, malignancy information. Using that information normal or irrelevant regions are ignored. To rectify abnormal regions, an ensemble of multiple statistical models are used. This model is checked and cross-validated on test data which is not used in training. Upon successful development of the model and satisfiable accuracy, it is used to predict the probability of cancer tumor.

How It Impacts Human Race

According to SEER report, Lung cancer is the deadliest cancer which kills more people than breast, colon, and prostate cancer combined. Every 3.3 minutes someone in the U.S. dies of lung cancer. Currently, CT scan which is a 3D image of lungs is used to detect possible cancerous regions. These scans are then carefully observed by trained radiologists. This procedure not only requires expert eyes but also labs with proper equipment. Nonetheless, it results in high false-positive detection; people with no cancer may be treated for cancer unnecessarily which is not only an economical burden but also psychologically stressful for both the patient and his/her family.

Prediction through ML can make this diagnosis process much simpler and reliable. Although statistics of current cancer diagnosis is making health experts upset, results from research and development in this area are showing lights of hope.

Like

Like
Love
Haha
Wow
Sad
Angry

Forecasting from Times Series model using Python

Playing with large set of data is always fun if you know how to do it. You can fetch interesting information from it. As part of my Master’s course I have had opportunity to work on forecasting using Times Series modeling. And yes, now I can predict future without being a clairvoyant. 😀

Considering popularity of R in Data Science, I started with R. But soon I realized it has learning curve. So, I opt out for Python. I am not going to write R vs Python because it is already written nicely here in DataCamp’s blog.

So, let’s get started. Time series models are very useful models when data points collected at constant time intervals. This time series stationarity is main per-requisite for the dataset. Until unless your time series is stationary, you cannot build a time series model. There is a popular example named “Random Walk”. The summary of the example is prediction becomes more inaccurate as input data is randomize.

We will use two completely different dataset to for prediction.

  • Nile Water Level between AD 622 to AD 1284. Get it here
  • Air Quality data of Italy taken on Hourly basis. Get it here

The reason we are taking two different model because we want to show multiple different Time Series models.

ARMA:

ARMA is basically combination of two different time series model AR and MA. AR stands for Auto Regressive and MA stands for Moving Average. In ARMA we work with single dependent variable indexed by time. This method is extremely helpful when we do not have any other data than time and one specific type of data. For example in case of Nile data we only have the water level data which is indexed by time(year). I am giving you warning, if your data is not stationary you will be tearing off all of your hair to fit the model. So, make sure your data is consistent to save your hair.

We have used Pandas for Data management.

We have used StatsModels ARMA method for prediction. It takes an mandatory parameter order which defines two parameters p,q of ARMA model. p is the order for AR model and MA is for MA model. Full API reference for this function can be found here. StatsModels also provides ARIMA modeling. In case of ARIMA model we just have to pass difference order parameter.

The predictors depend on the parameters (p,d,q) of the model. Here is the short description about it.

  1. Number of AR (Auto-Regressive) terms (p): AR terms are just lags of a dependent variable. For example if p is 5, the predictors for x(t) will be x(t-1)….x(t-5).
  2. Number of MA (Moving Average) terms (q): MA terms are lagged forecast errors in prediction equation. For example if q is 5, the predictors for x(t) will be e(t-1)….e(t-5) where e(i) is the difference between the moving average at the ith instant and actual value.
  3. Number of Differences (d): These are the number of nonseasonal differences, i.e. in this case we took the first order difference. So either we can pass that variable and put d=0 or pass the original variable and put d=1. Both will generate same results.

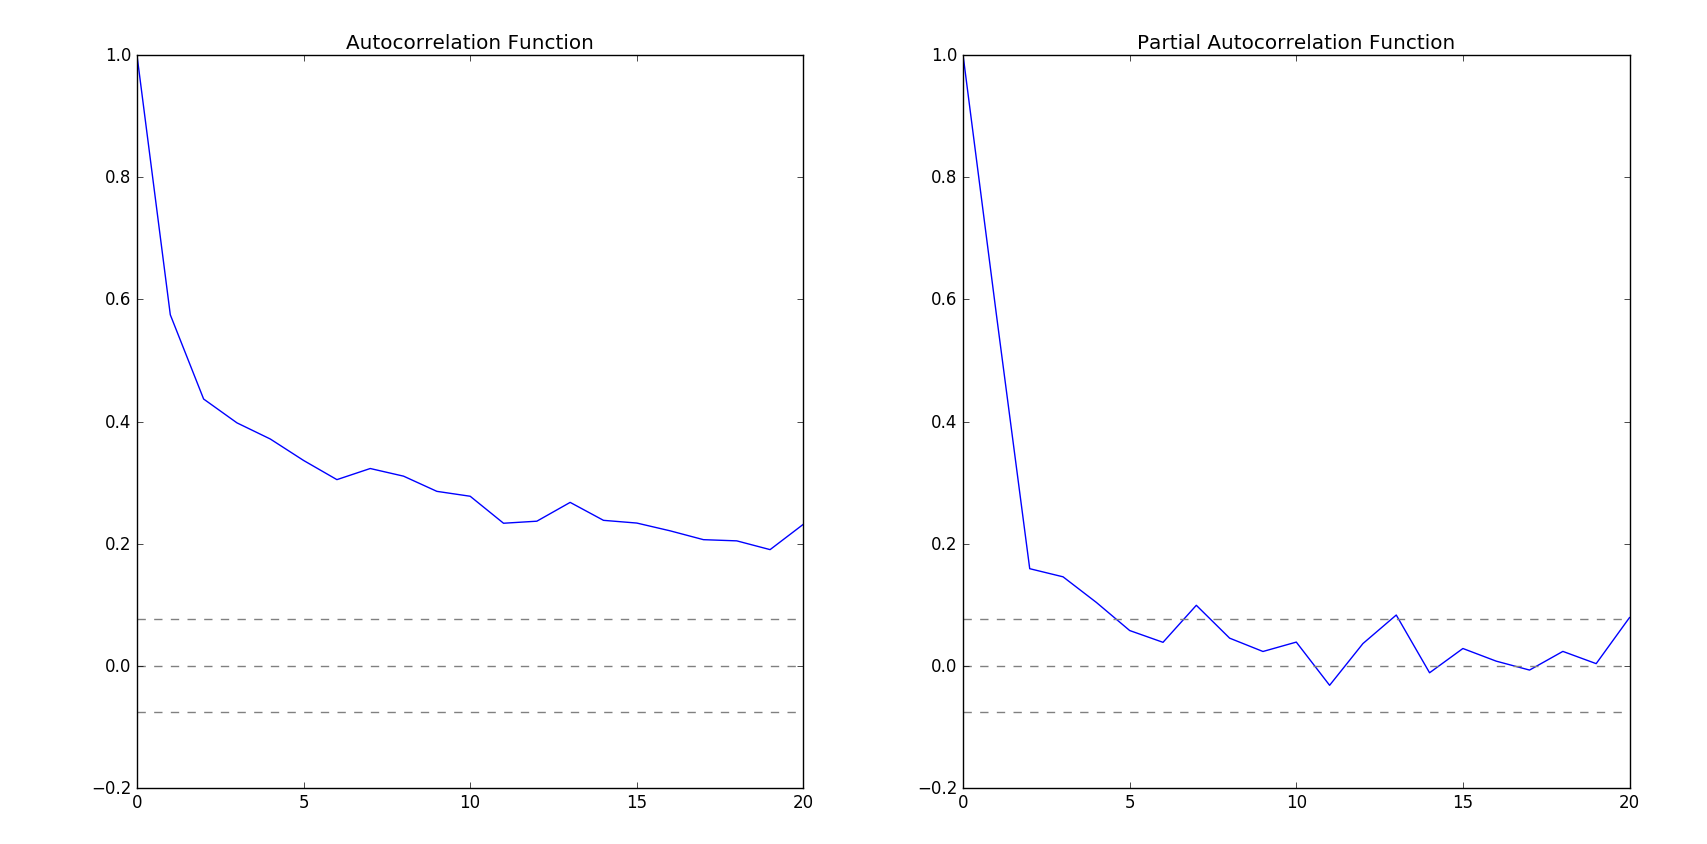
To calculate p and q I have run Autocorrelation Function (ACF) and Partial Autocorrelation Function (PACF). StatsModels have acf and pacf function to do this for us.

How I have done it:

At first, I have installed Anaconda to get everything I need. Yes. we have gathered the whole zoo to do our data science. Python, Pandas and now Anaconda. Don’t forget you can write your code in IDE named Spider. Whatever…


After that, I have used Pandas to read CSV. At first I was trying to fit ARMA on Air data. But since it was hourly data, fitting those data was difficult. Then I moved to Nile data. I was having hard time fitting Nile data because the time span for the data was out of the range of supported timestamp. So, instead of using DateTime index I switched to period range of Pandas. I have generated custom period range to support the time range. The while fitting ARMA model I passed the dates generated by the period range with annual frequency. For p and q order I have used ACF and PACF. I have calculated the lags and then plot it on a graph with bounds.

ACA and PACA observation

ACA and PACA observation

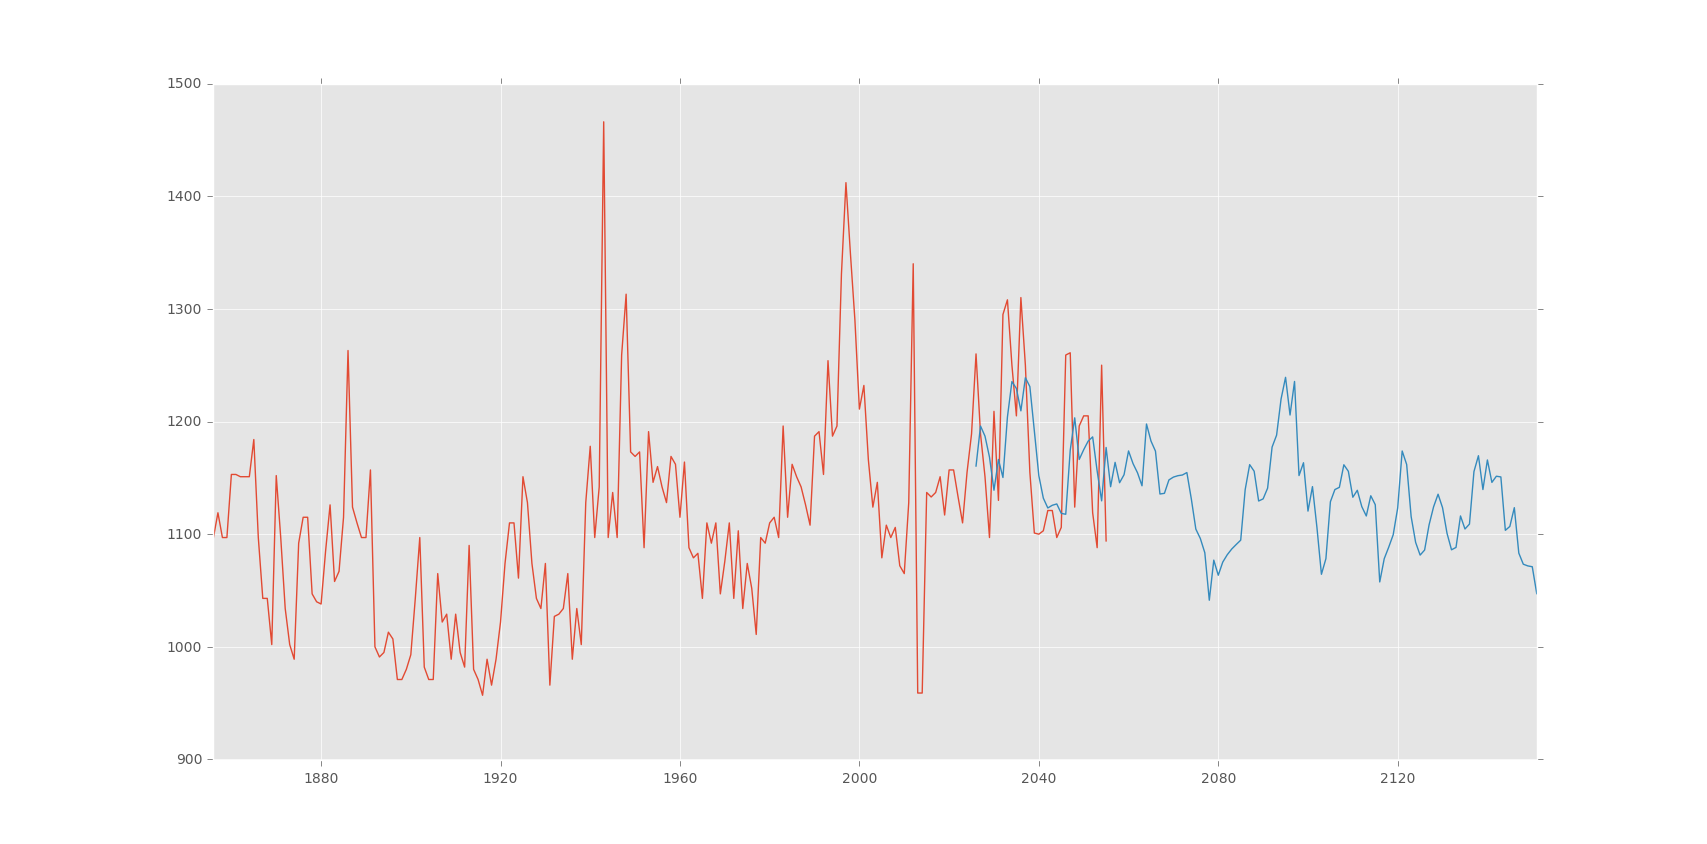
Observing the graph I have taken (2,2) as (p,q) order. After fitting the model I have predicted using the model. Here is the output of the prediction:

Nile Water level prediction

Nile Water level prediction


Linear Regression & Random Forrest Regression:

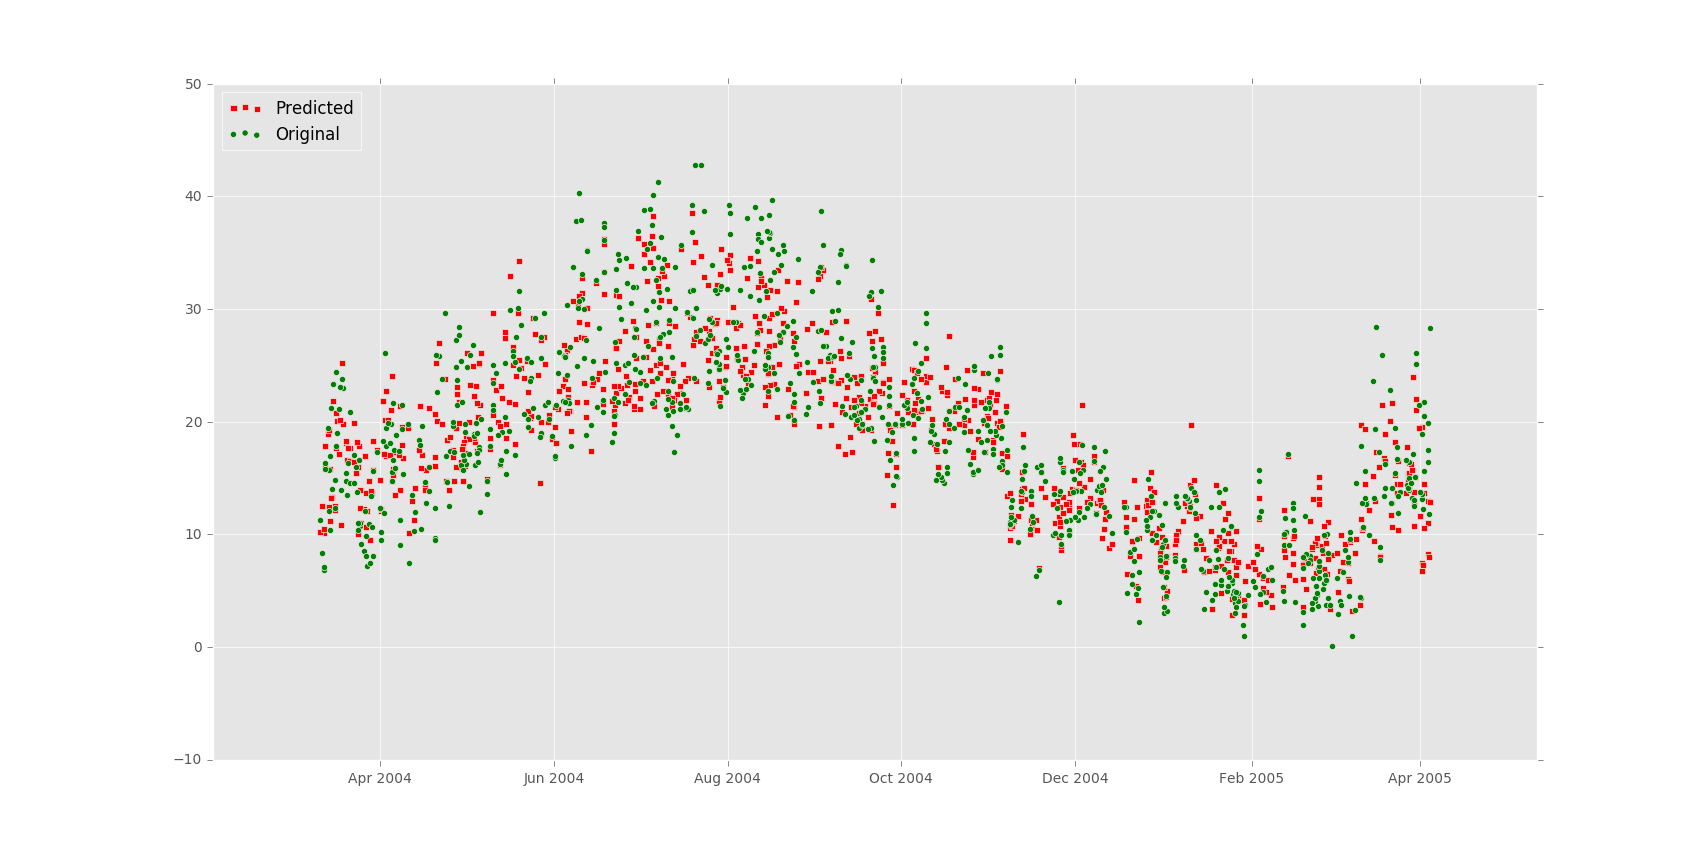
Besides ARMA and ARIMA model we have tried to use other prediction model. One of them are Linear Regression. SciKitLearn provides handful methods to do Linear Regression and Random Forrest Regression. I have ran these models on Air Quality data and got very good output. It has been observed that Random Forrest Regression generates more accurate predictions than Linear Regression. Random Forrest Regression has error rate of 12.8169340263% where as Linear Regression generates output with error rate 29.8718180357%.


How I have done it:

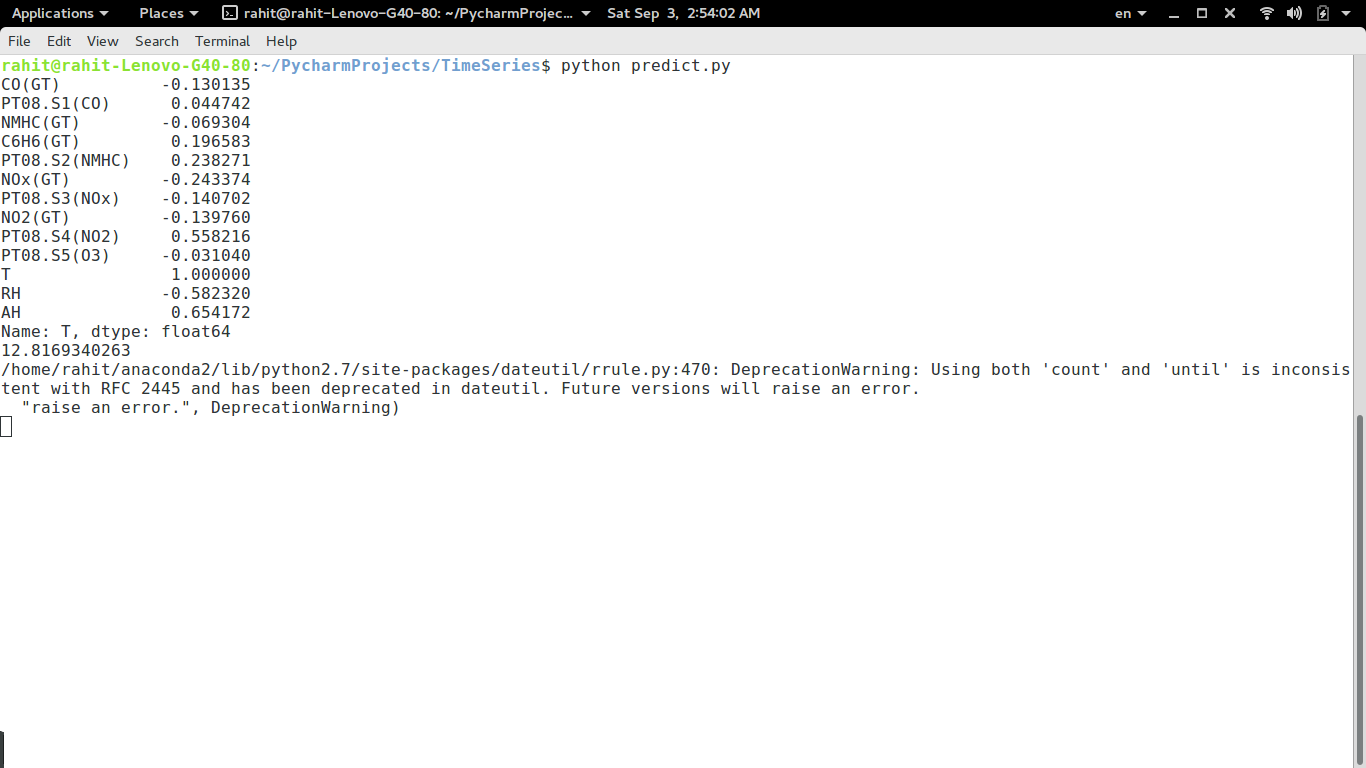
After reading data from CSV using pandas I have dropped NA(not available) or null values. Then I have omitted extreme values. I have run a co-relation calculation with all the columns against Temperature. The output was following:

Corelation with Temperature

Correlation with Temperature

Then I have run prediction model on on the data. I have considered Temperature “T” as the dependent variable and others as the independent variable. The output was following:

Random forrest

Random forest


Here is the code for everything I described above.

Like

Like
Love
Haha
Wow
Sad
Angry